Key Takeaways
- 104 matches across 39 days — $280M of projected visitor spend goes to food & beverage alone
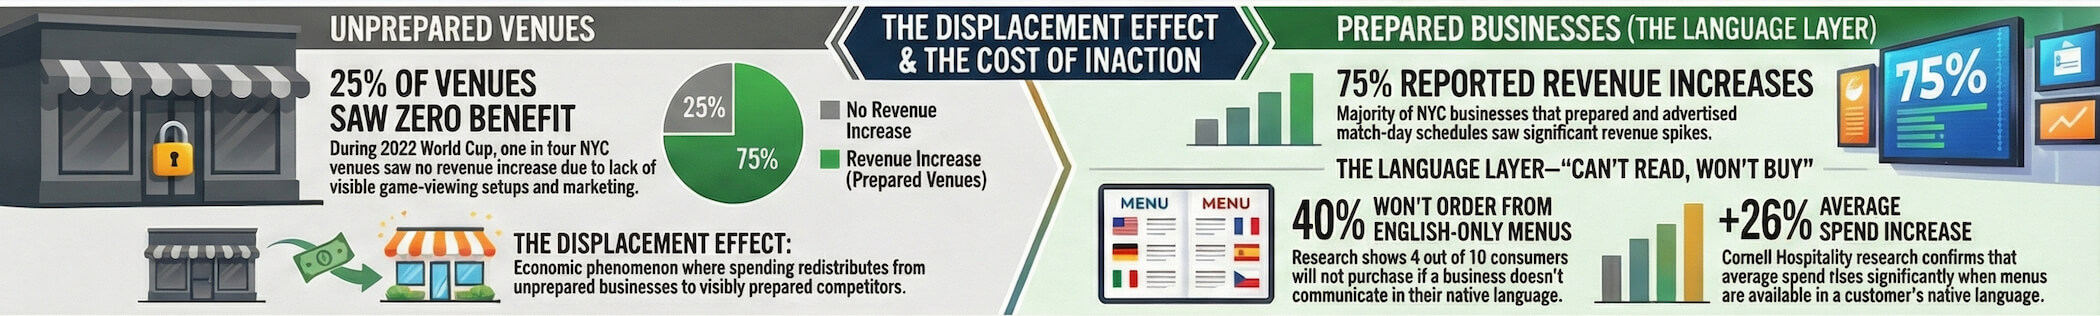
- 75% of NYC bars saw revenue increases during the 2022 World Cup; 25% saw nothing despite identical foot traffic
- Preparation — not location — is the #1 differentiator. The displacement effect means competitors capture your customers
- Spanish is the dominant non-English language in 8 of 11 US host cities
- Tournament starts June 11, 2026 — March is the last viable window for Google to index and rank new content
Here's a frame that puts the 2026 FIFA World Cup into terms every US business owner can understand:
The Super Bowl in New Orleans this February generated $1.25 billion in economic output for the city over a single weekend. Hotels ran at 95% occupancy. Restaurant and bar revenues doubled. It was the biggest one-weekend event the city had seen in years.
Now imagine nine of those weekends. Back to back. Across your city. For five weeks straight.
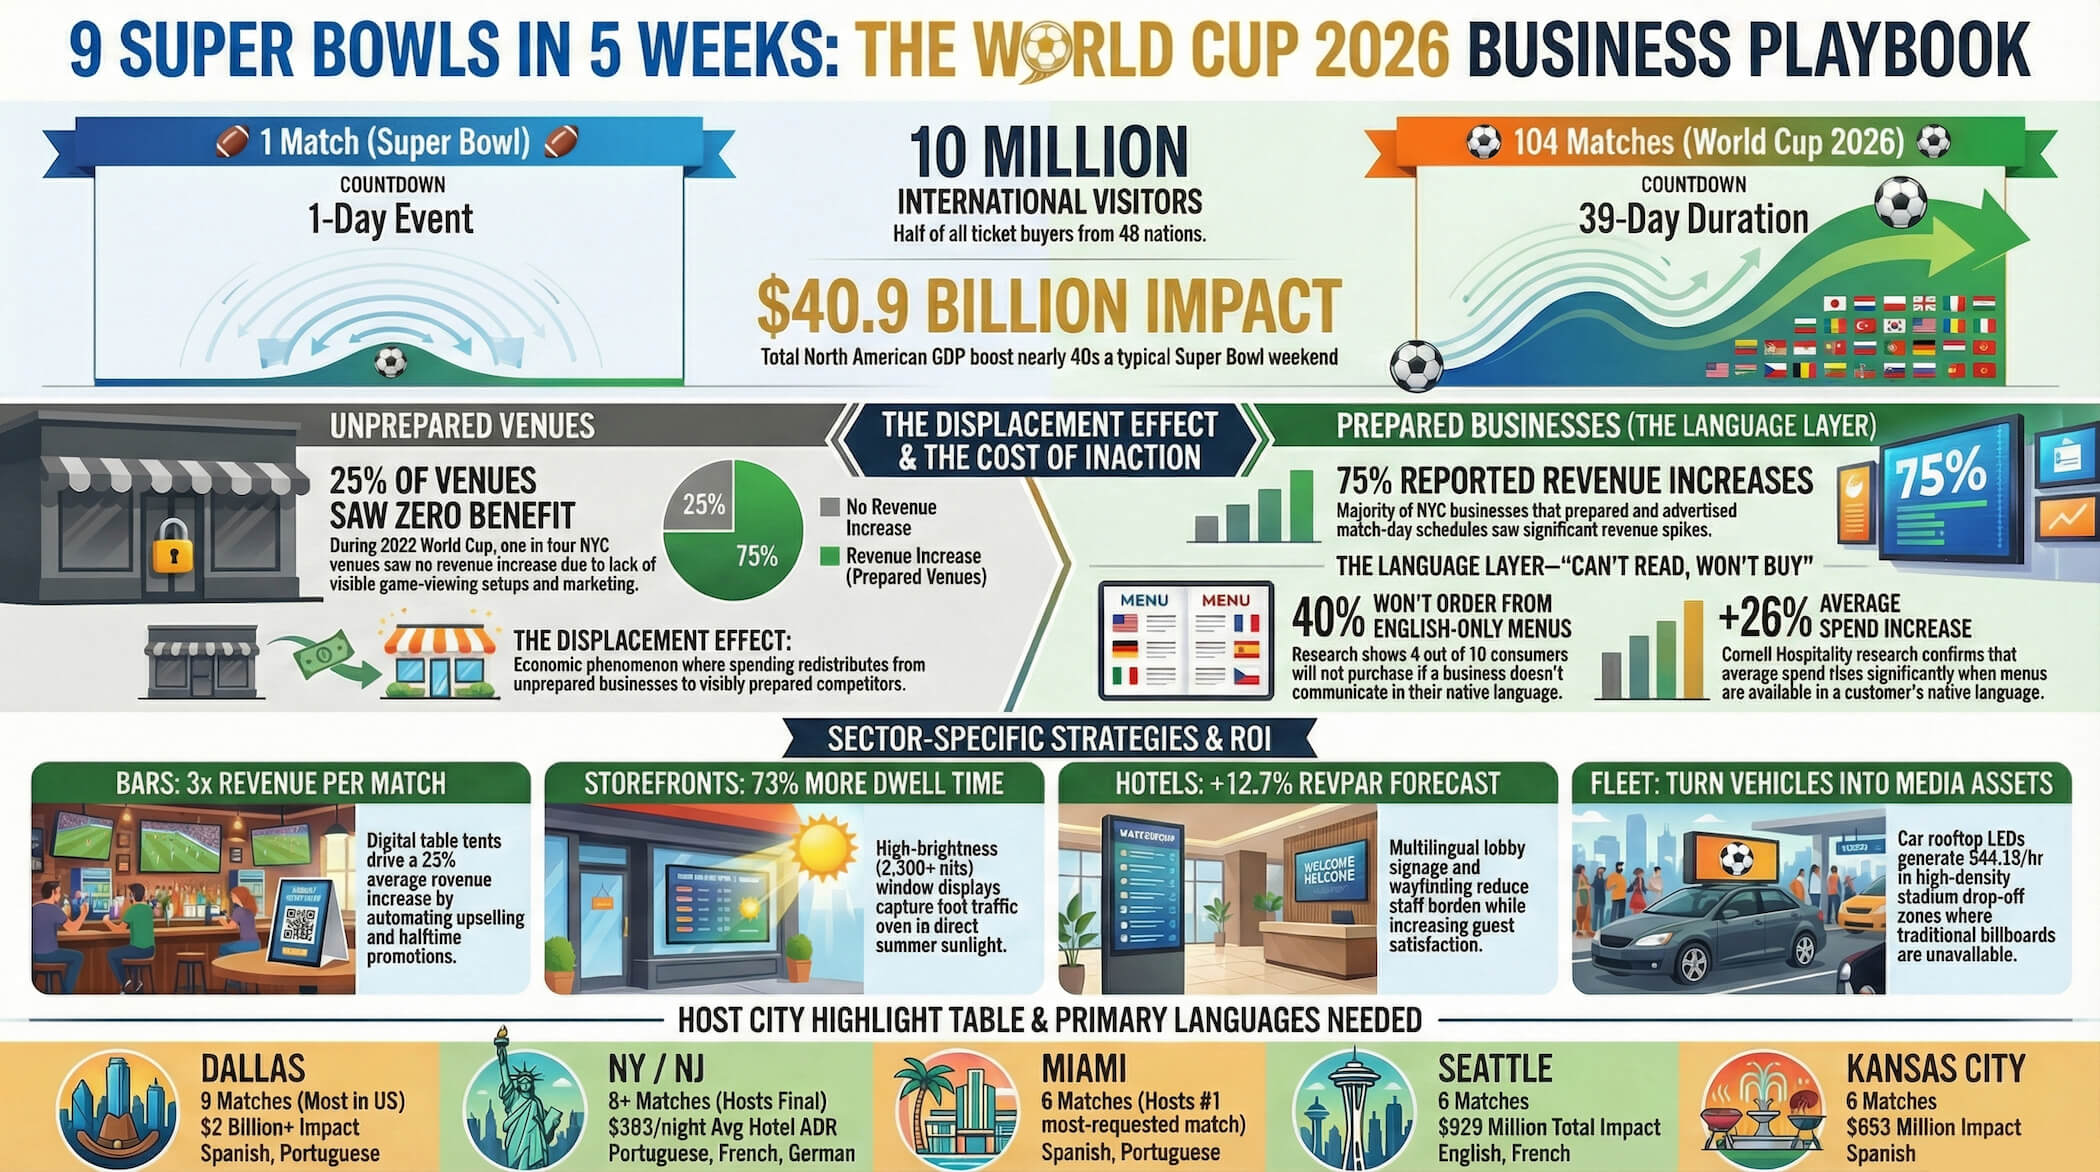
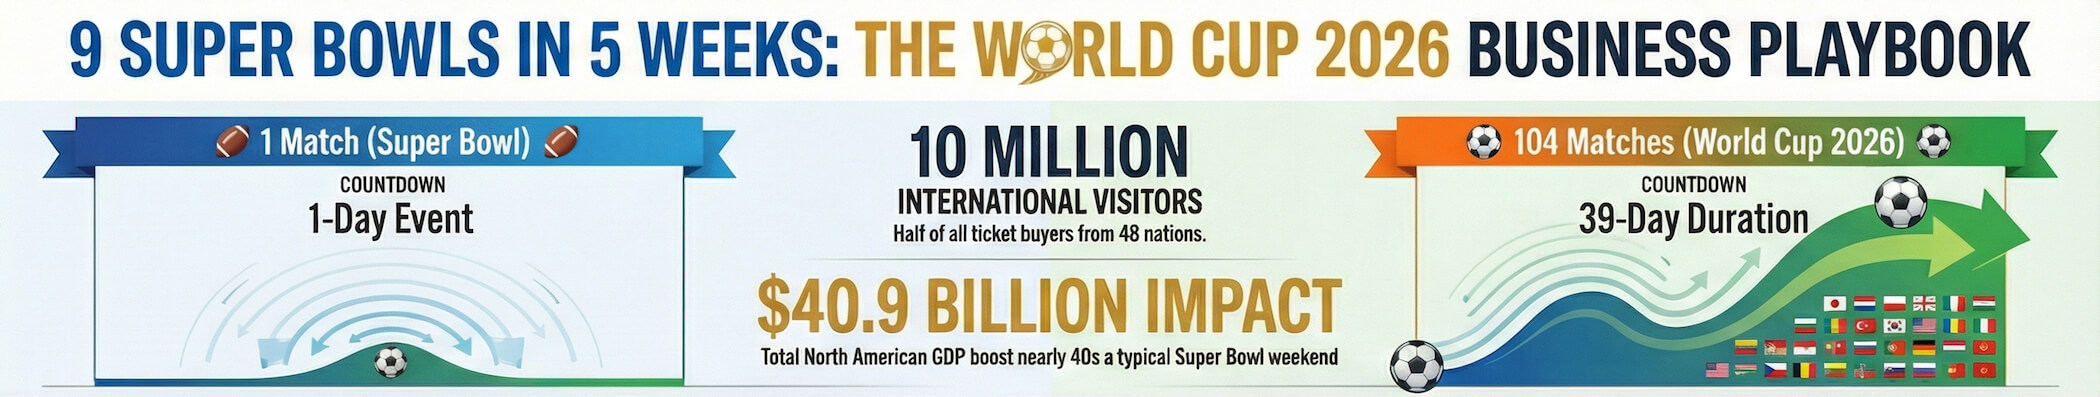
| Metric | Super Bowl | World Cup 2026 |
|---|---|---|
| Duration | 1 day | 39 days |
| Matches | 1 | 104 |
| Host cities | 1 | 16 (11 US + 5 international) |
| US attendance | ~65,000 | 6.5 million |
| International visitors | Primarily domestic | 10 million to USA |
| Economic impact | $1.25B (New Orleans 2025) | $40.9B North American |
| F&B share of visitor spend | ~40% | 50% ($280M per host cluster) |
| Preparation window for businesses | 2–3 weeks | Now through June 11 |
That is what the 2026 FIFA World Cup looks like for the eleven US host cities — Dallas, Houston, Los Angeles, New York/New Jersey, Miami, Atlanta, Seattle, Boston, Philadelphia, Kansas City, and San Francisco. 104 matches. 39 consecutive days. 6.5 million fans attending. 10 million international visitors total.
The difference between a restaurant that triples its revenue during those five weeks and one that sees no meaningful lift is almost entirely a matter of preparation. We know this because it already happened — in New York — during the 2022 World Cup in Qatar.
"According to a post-tournament survey by the NYC Hospitality Alliance of more than 130 operators, 75% of NYC bars and restaurants reported increased revenue during World Cup 2022 broadcasts. 25% saw no meaningful lift — and those venues almost universally shared one trait: they hadn't prepared for it." — NYC Hospitality Alliance, survey of 130+ operators
This guide is for the businesses that intend to be in the 75%.
The Numbers You Need to Know
According to Travel Daily News and the Data Appeal Company, the $280 million in food and beverage spending represents about half of the total $556 million projected for US host city spending. If you run a bar, restaurant, café, or any food-service business in or near a host city, this is real and quantifiable.
The $556 million doesn't distribute evenly — it clusters around stadiums, fan zones, and the neighborhoods where international visitors actually stay and eat.
Why Preparation Determines Whether You Win or Get Displaced
Economists studying mega-events have documented something called the displacement effect: World Cup spending doesn't simply add to existing revenue. It redistributes it. Visitors shift spending toward businesses that are visibly ready for them — and away from businesses that aren't.
A restaurant on a major street near a stadium, with visible displays showing match schedules and multilingual welcome signage, captures a disproportionate share of fan foot traffic. The identical restaurant two blocks away with a static sign and no visible game-viewing setup misses most of it.
⚠️ The 25% that saw nothing. In the NYC Hospitality Alliance's post-tournament survey after Qatar 2022, roughly one in four venues reported no meaningful revenue increase — despite WC traffic surging all around them. The common thread: no game-showing setup, no visible fan-facing signage, no match-schedule promotion. The World Cup does not automatically benefit everyone. Preparation determines who captures it.
What Five Weeks Actually Looks Like for Your Business
For businesses accustomed to Super Bowl economics — a single massive weekend — the World Cup operates on an entirely different model.
48 matches in 15 days
Multiple games per day. Your city hosts 6–9 matches. For bars and restaurants, this is the highest-volume period — constant activity, new fans every 48 hours.
Round of 32 & Round of 16
Each match carries higher stakes. Watch-party turnout increases. Business concentration grows as the bracket narrows.
Peak event intensity
Atlanta hosts the July 15 semifinal. Dallas hosts the other. These cities operate at Super Bowl-level activity for those match days.
MetLife Stadium, New Jersey
The single most-watched sporting event on earth. The New York metro area that weekend is in a category of its own. More ticket requests came in for this match than any other in World Cup history.
Which Businesses Benefit — and How Much
Bars & Sports Bars
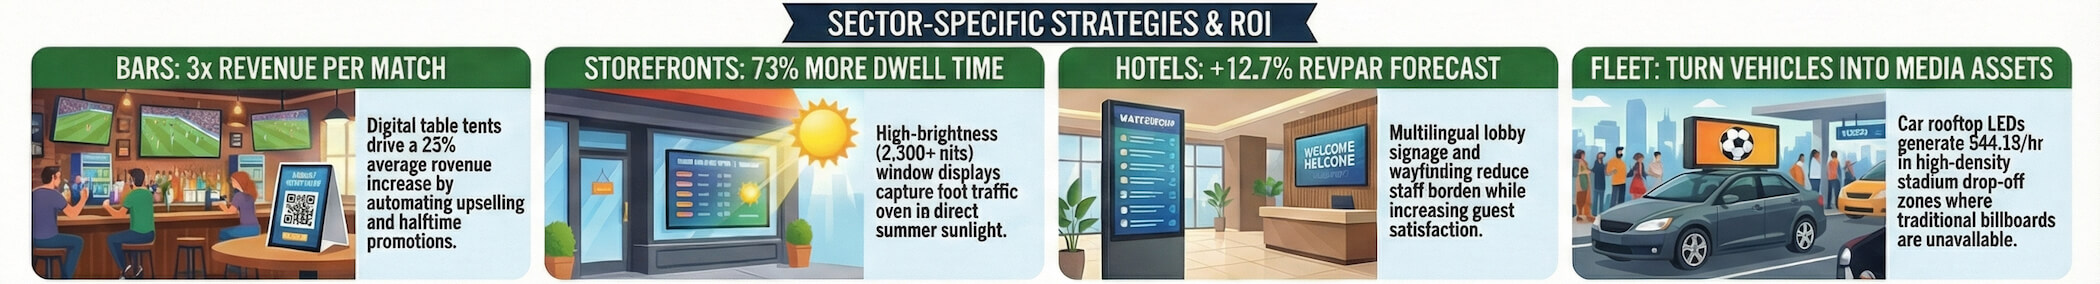
The most direct beneficiaries. During Qatar 2022, Pig Beach BBQ in Queens reported 2–3× normal daily revenue on match days. An unnamed brewery called the USA vs. Netherlands match a top-10 sales day in the brewery's entire history. Research across sports bar operators shows dynamic digital signage correlates with a 23% average revenue increase during sports events, primarily through upselling and faster table turns.
Restaurants & QSR
Two revenue layers: walk-in traffic from fans exploring the city between matches, and table-level dining during match viewing. Critically, the top ticket-requesting countries outside the host nations are Colombia, England, Ecuador, Brazil, Argentina, Scotland, and Germany. According to Cornell University's School of Hotel Administration, multilingual menus increase average customer spend by up to 26%.
Hotels
Host-city hotel RevPAR is forecast to increase 12.7% during June and July 2026 specifically. Dallas game-day RevPAR was already tracking 500× higher than the prior year at 189 days out. The operational challenge is multilingual guest services — lobby digital displays that deliver match schedules, wayfinding, and local recommendations reduce staff burden while lifting guest satisfaction.
Retail & Storefronts
International tourists represent the highest per-visit average spend of any customer segment. Fan merchandise, local specialty goods, and any retail adjacent to fan zones will see concentrated foot traffic on match days. The conversion challenge is identical across all retail: stopping pedestrian traffic at the window.
Fleet & Mobility Operators
Taxi companies, shuttle operators, and fleet vehicles will run at maximum capacity throughout the tournament. For operators who own vehicles, rooftop LED displays become valuable advertising inventory at the exact moment when rider volume in host cities is highest. A category with virtually no existing guidance — and significant untapped opportunity.
Events & Pop-Ups
Fan zones, watch-party venues, outdoor brand activations, food trucks, and popup retail represent an emerging category. According to a February 2026 New Jersey Governor's press release, New Jersey alone has allocated $5 million in state funding for World Cup fan zone initiatives. Businesses that can deploy mobile, self-contained digital signage have a distinct advantage over those relying on static banners.
Host City Quick Reference
| City | Matches | Projected Impact | Key Match | Primary Fan Languages |
|---|---|---|---|---|
| Dallas / Arlington 9 matches — most of any venue |
9 | $2B+ for DFW region | Semifinal host | Spanish, Portuguese, German |
| Houston | 7 | $1.5B+ | Official training hub | Spanish, Portuguese |
| New York / NJ The Final — July 19 |
8+ | $67M direct spend | THE FINAL · July 19 | All languages, highest diversity |
| Miami | 6 | Significant | Colombia vs Portugal — most requested match globally | Spanish, Portuguese, French |
| Atlanta Semifinal host |
6+ | $52M+ direct | Semifinal · July 15 | Spanish, French |
| Los Angeles | 8 | $251M+ follow-on | USA opener · June 12 | Spanish, Korean, Portuguese |
| Seattle | 6 | $929M total | Strong soccer culture | Spanish, English (UK) |
| Kansas City | 6 | $653M; 650K visitors | Argentina · June 16 | Spanish (heavy) |
If your business is in one of these cities, the tournament isn't background noise — it's the primary revenue event of 2026. Even in non-host cities within 2–3 hours of a host, the watch-party opportunity is substantial: 87 million Americans describe themselves as interested in the World Cup.

The Signage Layer: Four Tools, Four Opportunities
Across all industries, the common infrastructure that separates prepared businesses from unprepared ones is dynamic, remotely managed digital signage. The World Cup runs for 39 days, with multiple matches per day, shifting schedules, and a new language profile walking through your door every 48 hours. A static sign updated once a week cannot do this work.
For Bars & Restaurants
Digital Table Tent
A 15.6" counter display that drives upsells at the moment of decision. During a World Cup match, when a customer is seated and engaged, a table-level display showing halftime specials or next-match promos converts at rates no server can match alone. Update every screen in the venue in 30 seconds.
How bars are using this to 3× match-night revenue
For Any Storefront
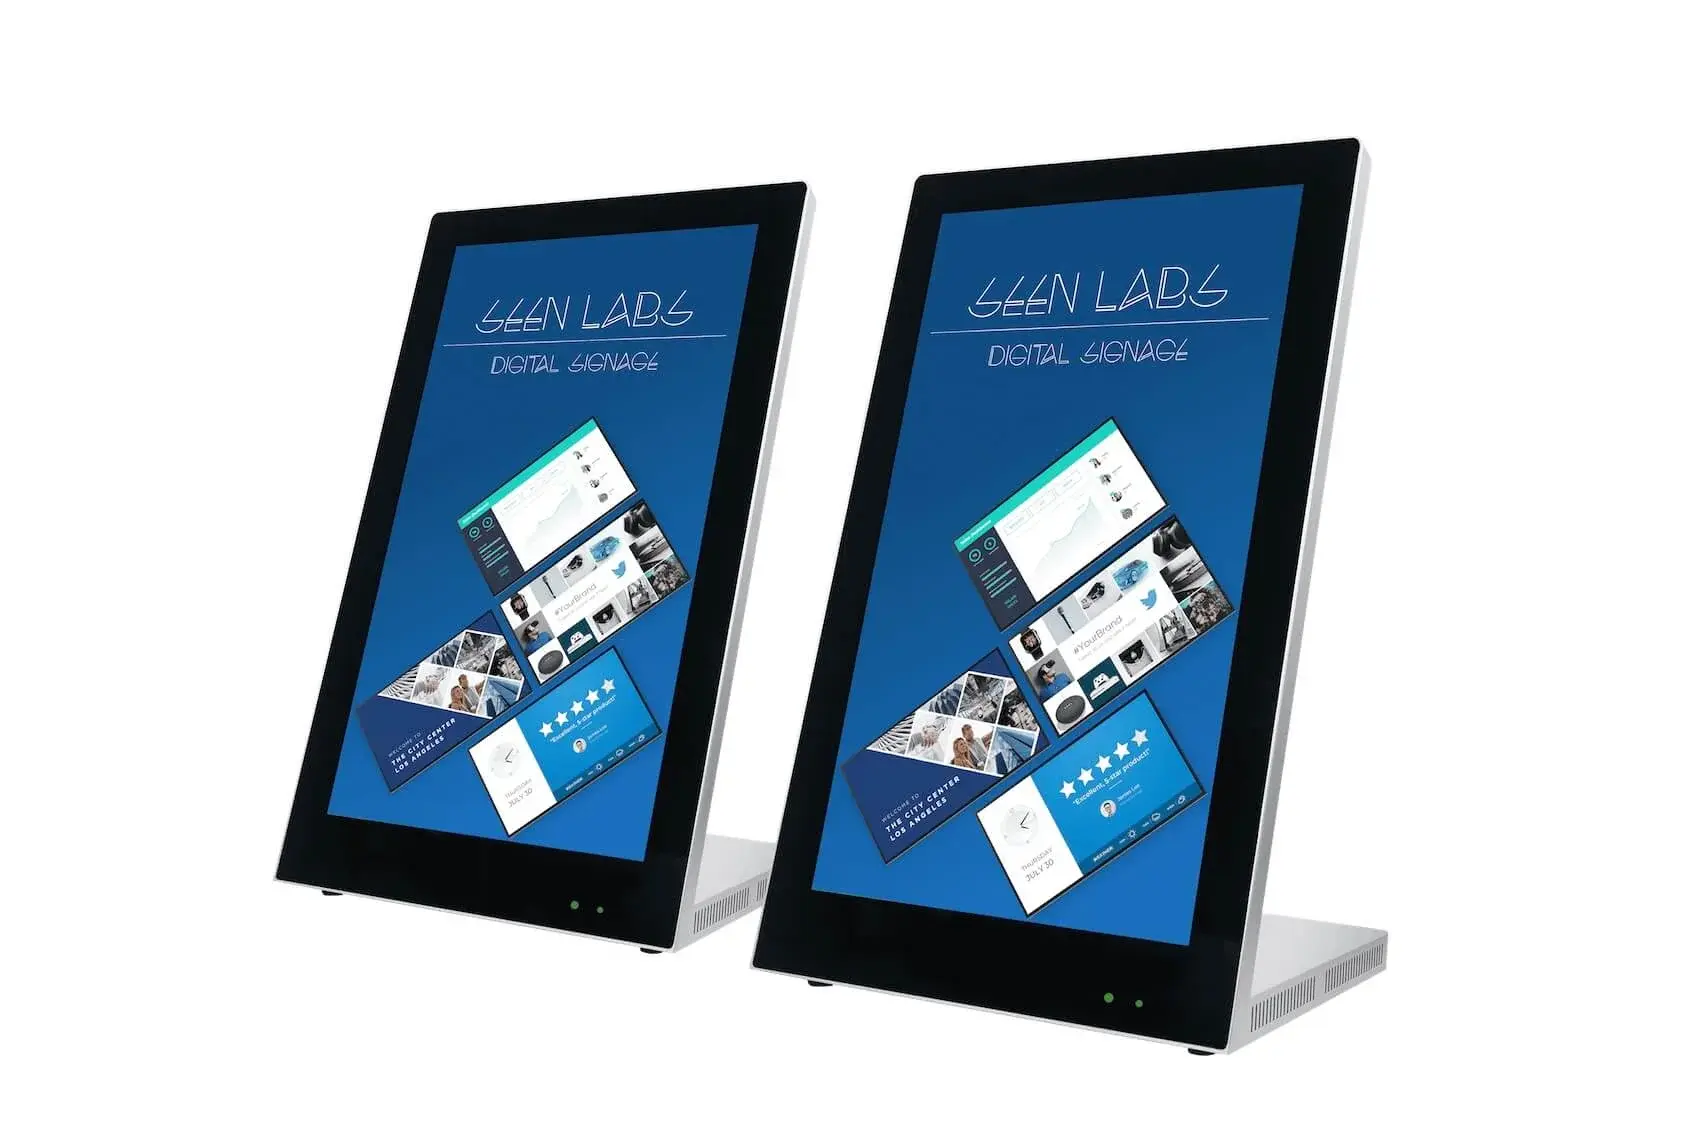
Window Display Screen
A high-brightness screen mounted to face the street. Visible in direct summer sunlight. Shows your specials, match schedule, and welcome messages to every pedestrian who walks past. Your most passive salesperson: no labor cost, 24/7 for 39 days straight.
How storefronts are capturing fan foot traffic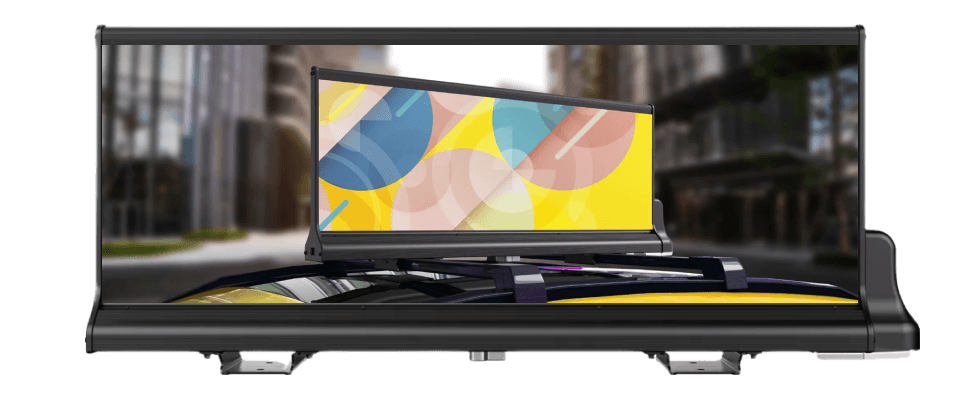
For Fleet & Taxi Operators
Car Rooftop LED
LED advertising screen mounted to vehicle rooftop. During a tournament generating millions of stadium trips, airport pickups, and city rides, a moving LED billboard passes more potential customers per hour than any fixed location. Taxi and fleet operators — this is your highest-value inventory window.
The fleet advertising opportunity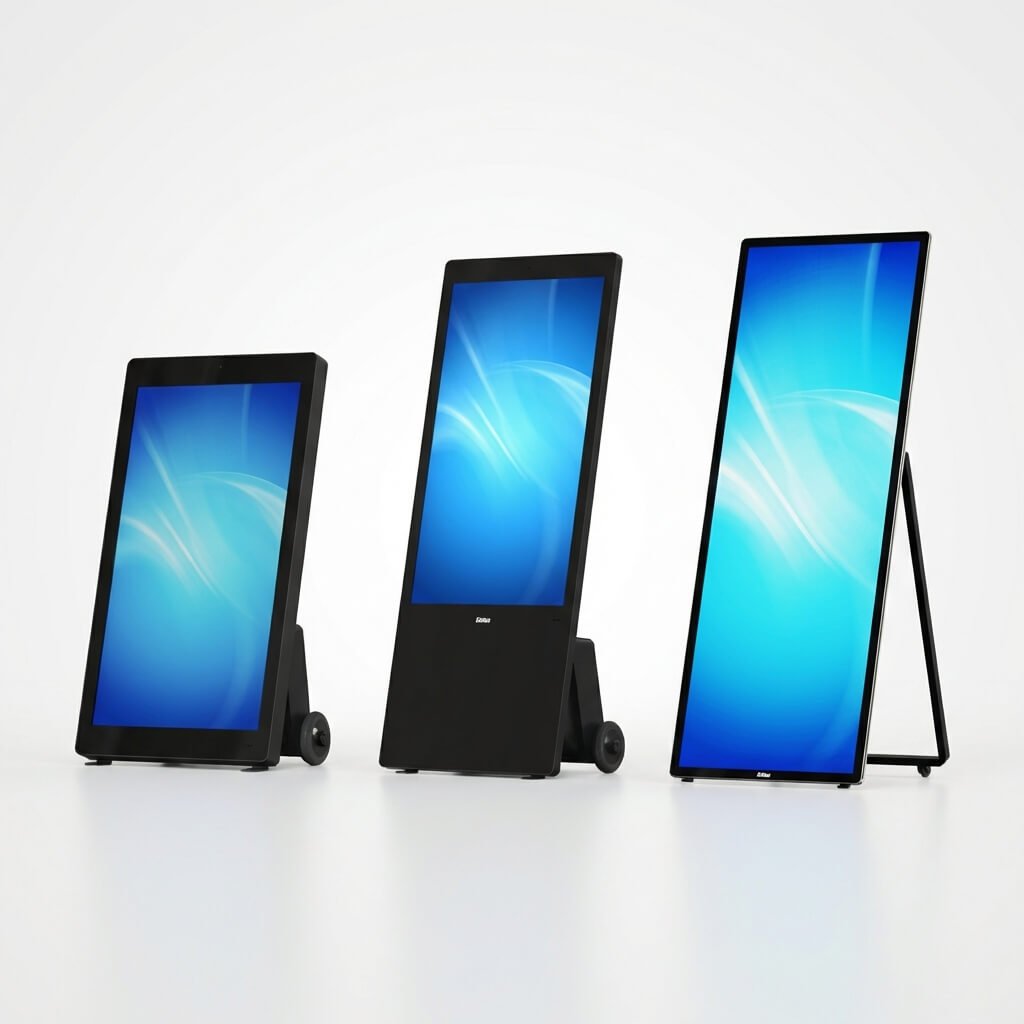
For Events & Pop-Ups
Portable Digital Signage
Battery-powered standalone display that deploys in minutes — no installation, no drilling, no power outlet required. Designed for fan zones, watch party setups, popup activations, and food trucks. Set it up, show what you need, pack it up, and move to the next city.
Fan zone and watch party setup guideSeenLabs provides all four of these as managed solutions — hardware, cloud content management, and setup support included. You don't need a designer or a technician to update content. Manage everything from your phone.
The Multilingual Dimension Most Businesses Haven't Addressed
The 2026 World Cup will bring fans from 48 nations to US host cities. The dominant fan languages after English are Spanish, Portuguese, German, French, Arabic, and Korean. In cities like Miami, Dallas, Houston, and Kansas City, Spanish-speaking visitors will represent a significant plurality of international fan traffic — in some cases the majority.
📊 According to CSA Research, 40% of consumers never purchase from businesses operating in a language they don't understand. According to Cornell University's School of Hotel Administration, multilingual menus increase average customer spend by up to 26%. In February 2026, the Missouri Restaurant Association directly responded by launching "Lingo Eats" — an app that translates menus into 28 languages specifically for World Cup preparation.
A digital display system lets you rotate content by language based on which match is playing. When Brazil plays Portugal and your restaurant is in Miami, your menu screens show Portuguese. When Colombia plays the US, they show Spanish. This is a configuration option in any remotely managed display system — not a custom development project.
The businesses that address multilingual presentation proactively will capture more of the international visitor spend. Those that don't will watch it walk past their windows toward competitors who did.
Your 90-Day Preparation Checklist
With kickoff on June 11, the preparation window is now. Hardware lead times, content setup, and staff training all compress fast.
- Now → March 15: Decide which signage tools your business needs. Order hardware (allow 2–4 weeks for delivery and installation). Secure watch-party streaming licenses if applicable.
- March 15 → April 30: Create your World Cup content templates. Match schedules for your city, promotional packages, multilingual welcome screens. Set up content calendar so updates happen automatically as the tournament progresses.
- May 1 → June 10: Launch pre-tournament promotion. Window displays active. Social media announcing you're showing matches. Staff briefed — anyone can swap content in 30 seconds.
- June 11 → July 19: Operate in real time. Update specials between matches. Rotate language settings as the bracket evolves. Monitor which content drives the most engagement and adjust.
- After July 19: Your signage infrastructure is now a permanent asset — not a one-event expense. The digital table tents, window displays, and content management system you installed for the World Cup will drive revenue for years.
⏱️ Don't start in May. The businesses that will outperform their competitors will have infrastructure in place before the first ball is kicked — and they'll use it to capture every one of the 104 available match-day revenue moments.
Is Your Venue Ready for World Cup 2026?
5 questions. 60 seconds. Find out where you stand — and what to do next.
How many languages does your menu or signage currently support?
How do you currently promote match-day specials?
Is your business located in or near a World Cup host city?
Do you have a plan for 2–3× normal foot traffic on match days?
Can you update your in-venue signage in real time without calling anyone?
Deep Dives by Industry & Product
This playbook covers the full strategic picture. The following articles go deep on each specific use case:
SeenLabs · Managed Digital Signage
Ready to be in the 75%?
Get a free proposal for your venue. We'll assess your location, match schedule, and visitor profile — and recommend which signage setup captures the most revenue during those 39 days.
Get Your Free World Cup Signage ProposalProposals delivered within 24 hours · No commitment required · Volume discounts for multi-location operators
Sources & References
- NYC Hospitality Alliance — Post-Tournament Survey, 130+ Operators (2022 FIFA World Cup)
- Marketplace.org — Pig Beach BBQ World Cup Revenue Report (2022)
- Travel Daily News / Data Appeal Company — 2026 FIFA World Cup Visitor Spending Projections
- Cornell University School of Hotel Administration — Multilingual Menu Impact on Consumer Spend
- CSA Research — Can't Read, Won't Buy: Consumer Language Preferences (2020)
- KCTV5 News — Missouri "Lingo Eats" Program Launch, February 2026
- OptiSigns — Digital Signage Revenue Impact in Sports Bars and Restaurants
- Clemson University — Economic Displacement Research at Major Sporting Events
- New Jersey Governor's Office — Press Release: $5M Community Fan Zone Commitment, February 2026
- FIFA — 2026 World Cup Official Match Schedule and Venue Data
- CoStar / Hotel Dive — 2026 World Cup Host Market RevPAR Projections
- STR — Qatar 2022 Hotel Performance Data (ADR +302%)
- Dallas Innovates / WFAA — Dallas 2026 World Cup Economic Impact ($2B+)
- The Rideshare Guy / Blindspot — Rideshare Vehicle OOH Advertising Economics